

Local Development
Debugging Locally
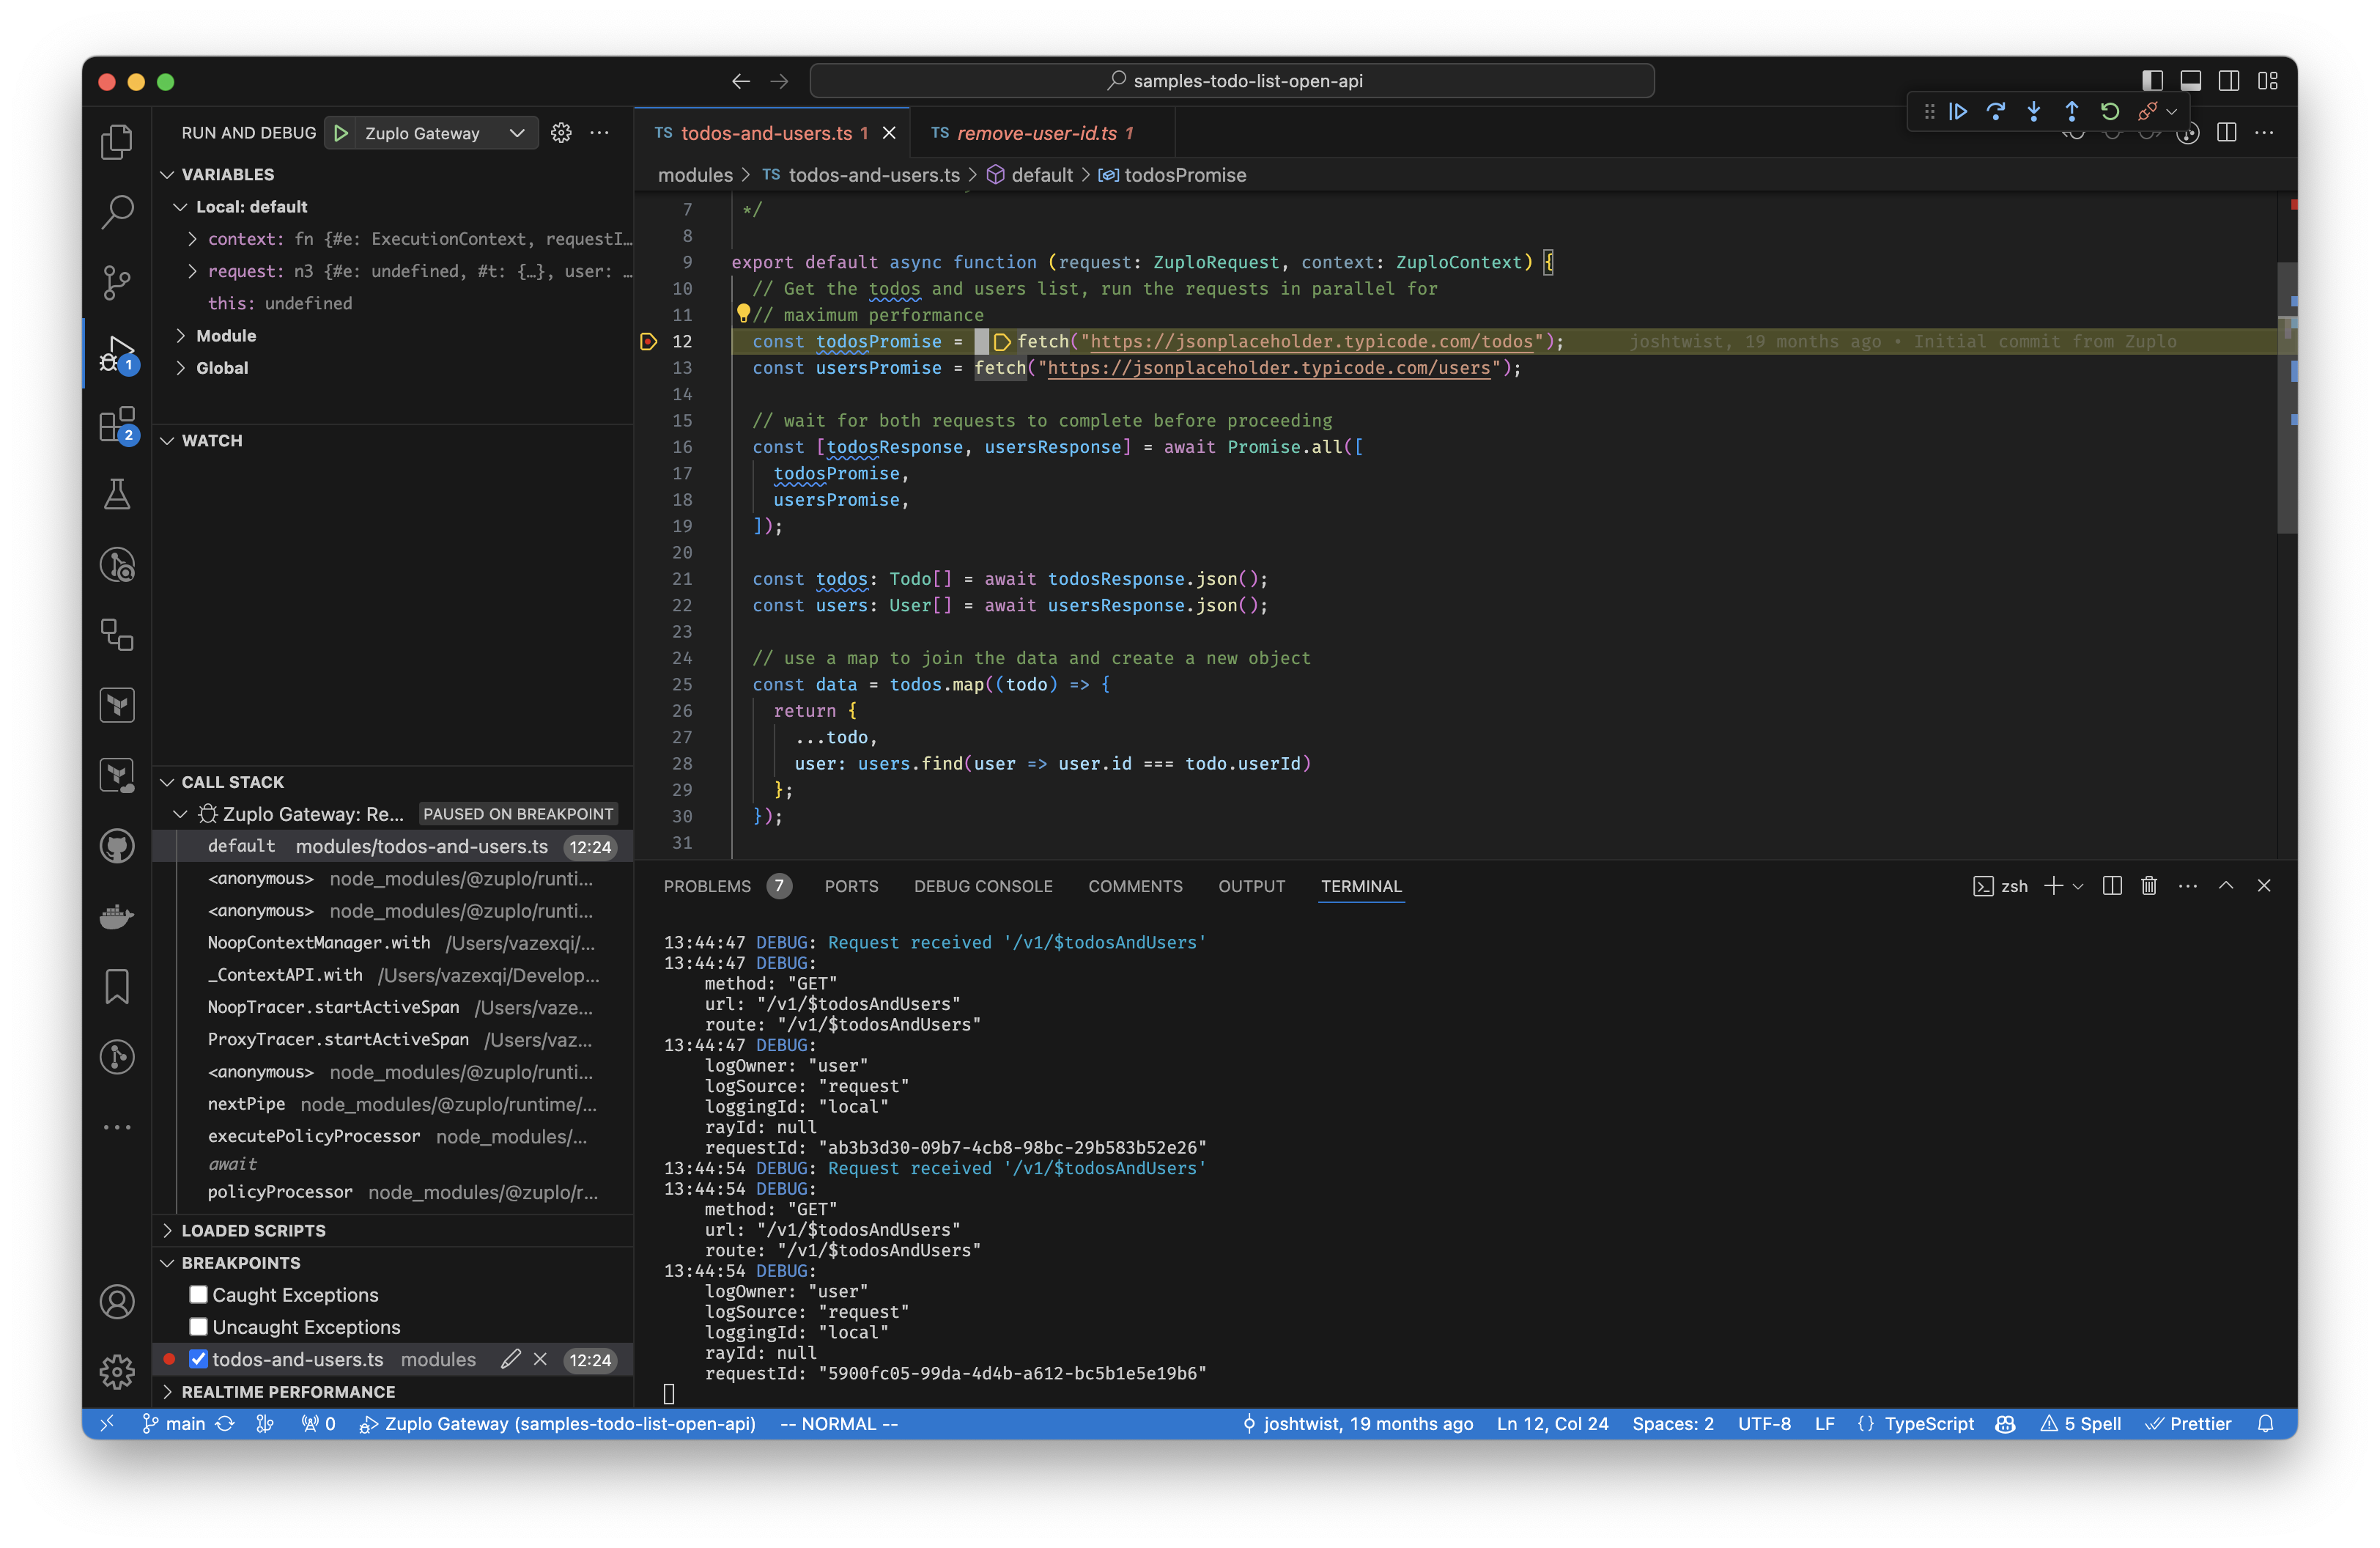
You can debug your local gateway through VS Code using its TypeScript debugger. Features such as breakpoints, stepping through the code, variable inspection, etc will be available to help you debug your gateway.
- Create a
.vscode/launch.jsonfile with the following content. If you already have an older/existing.vscode/launch.jsonfile, you can add the section in the curly braces to the configurations array. Take note of the port value since that's the value you will specify next.
{
  "configurations": [
    {
      "name": "Zuplo Gateway",
      "type": "node",
      "request": "attach",
      "restart": true,
      "port": 9229
    }
  ]
}json- Start the gateway in debug mode using the port that you specified above.
npx zuplo dev --debug-port 9229bash
- Switch to the View > Run and Debug in VS Code. You can now attach the debugger by selecting Zuplo Gateway and clicking the green triangle.
Limitations
- We only support stepping through your own module code. System code provided by Zuplo are minified and stripped of source maps, so you won't be able to step through them.